How to print a master-detail report
Description
Allows printing data from a database.
The setting of the Report button is almost the same as the setting of the Search button, since in fact both actions search the database and then display the search result, only in our case we will see the search result when printing. After setting up the button, you need to call the report designer to create a template, which will determine exactly how the document will look when printed, but everything in order.
As an example, we will implement printing of payments from the client. It will look as shown in the picture below:
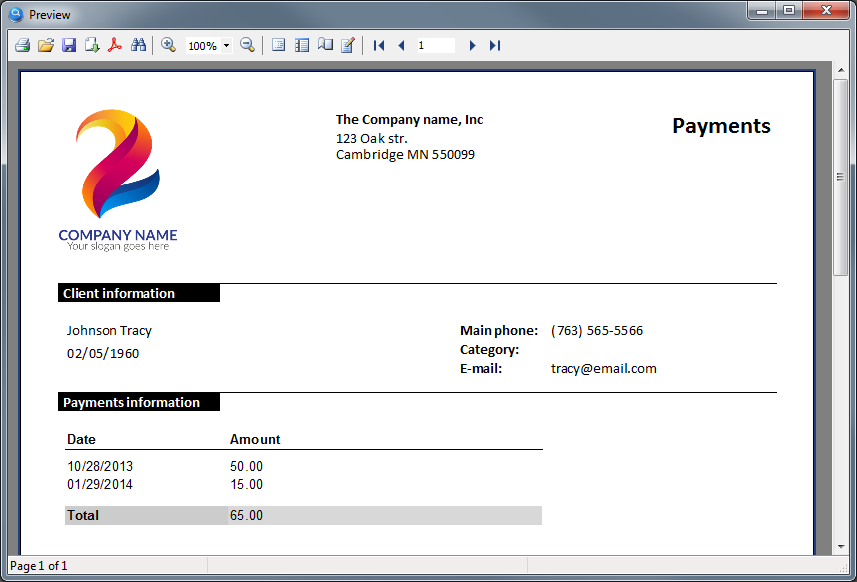
This type of reports is also called Master-Detail. In our example, the information about the client is Master (parent record), and the list of payments of this client is Detail (child records).
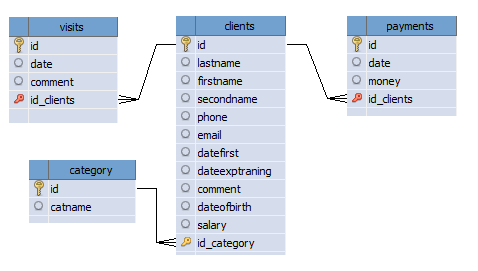
Database structure, which is used for this example:
Select the "Report" action for this button, the setting of this button is shown in the figure below:
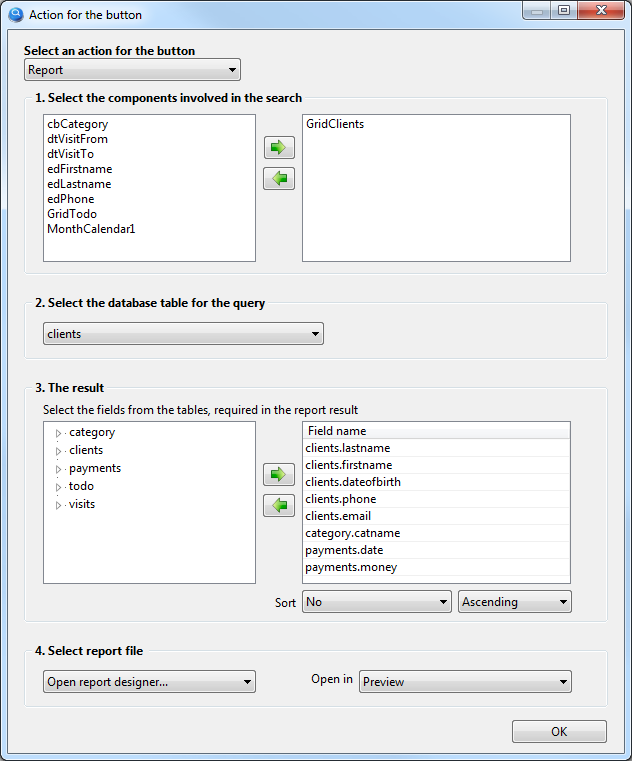
Let's consider this setting in detail by steps:
- Select the components involved in the search
The GridClients component is selected here, where we see all our clients, so only the client that was selected in the GridClients component will be in the report. If there is no component in this list, then the report will receive all data from the selected database table.
- Select the database table for the query
We will print information about the client, respectively select the "clients" database table.
- The result
Select the table fields that we need in the report.
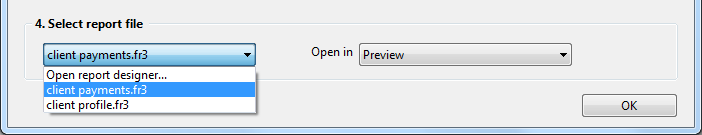
- Select report file
Since the report template has yet to be created, this setting should select "Open report designer...".
A report template is a file that defines exactly what the report will look like, this file will be created in the report designer and will be saved in the Report folder of your project.
|
A nuance worth noting here. As you can see from the settings in p.2, to generate the result we select fields from 3 different tables (clients, category, payments), as a rule, in other programs you need to write an SQL query, which manually specifies how one table, links to another table and in what sequence. The program My Visual Database tries to understand by itself how tables should be linked to each other in order to get exactly the data you expect, thus saving you from the need to learn the SQL query language. Unfortunately, it is not always possible for the program to predict how tables should be linked to get the data you would like to see. Such a situation can occur when you need to link 3 or more tables and if there are no obvious links between them. What should we do? On the "Database tables" tab, under each table, there is a checkbox "The table is a dictionary". On this tab, you should note which tables in your project are dictionaries. But how to understand which tables are dictionaries? Examples of dictionary tables are the table containing country names, Statuses (Open, Closed), Types (Legal Entity, Physical Entity), name with prices, etc. That is, such tables, which, as a rule, are filled in first at the start of work with the database and are not edited or edited rarely in the future. In this case, the dictionary table can be referred to the "category" (client category), for this table you need to check the "Table is a dictionary" box under these tables, so you will help the program to link the tables correctly. |

To create a report template, you need to run the project 
In the launched project, click this button with the report action, so you will open the report designer.
This report will be a bit more complicated than the previous one, as it will use so-called blocks (or Band). Blocks allow you to create almost any report structure. Some of them we will now get acquainted with.
To view all available blocks, click on the left icon  , then you will see a menu as shown in the figure below
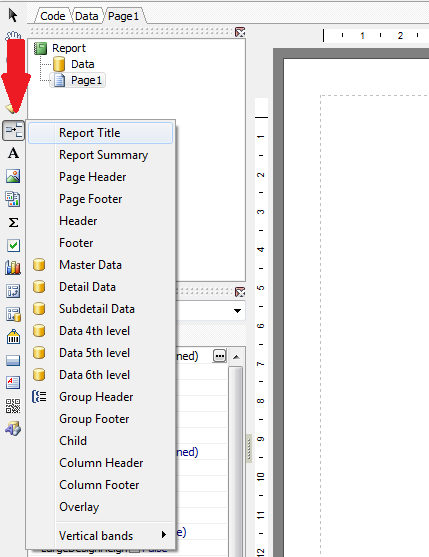
Let's start creating a report using blocks and find out what they are for.
From the menu shown in the figure above, select the Report Title block and this block will appear in the report. The information in this block will be printed only on the first page of your report.
Place the logo and company information in this block. As a result, you should succeed as shown in the figure below:
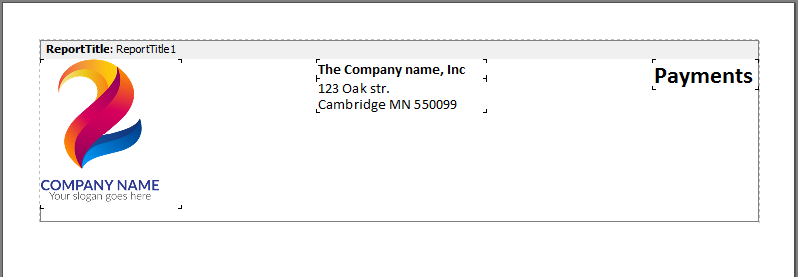
You can skip this block if you do not need a title for your report.
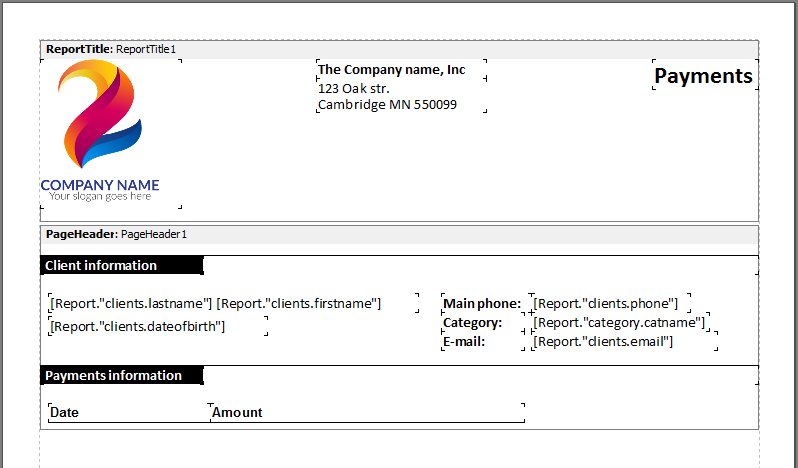
Place the next Page Header block. The information placed in this block will be displayed on each printed page (in case your report does not fit on one page).
In this block we will place the information about the client. We will also place the headers for the table which will be located in the next block.
Place the text and data fields in this block as shown in the picture below:
The next block to be placed in the report is Master Data.
This block is designed to output information in the form of a table. With the help of this block we will get a table where we will see all payments from this client.
Place this block in the report by selecting it from the menu. Before it appears in the report, you will see a window with the title Select DataSet, in which you need to select the data source. Select a data source from the list with the title Report and click OK.
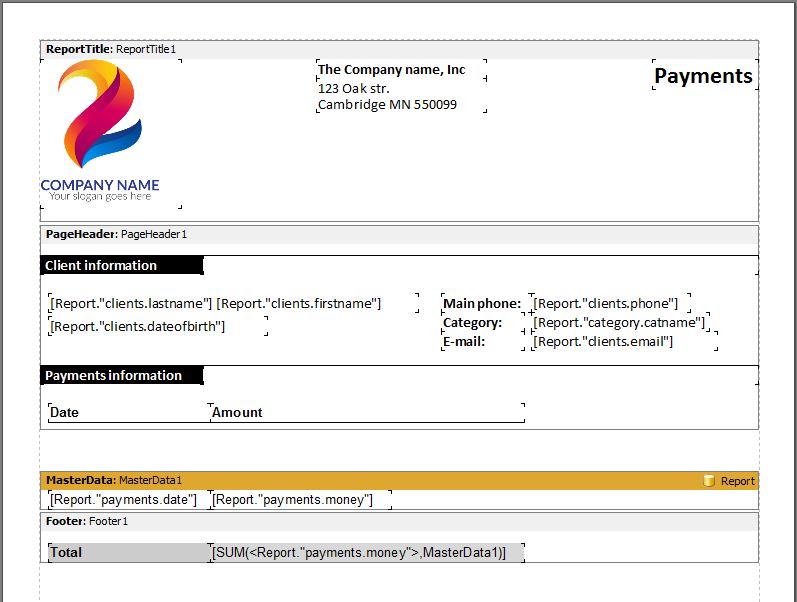
In this block, place the database fields that you need in the table. As a result, you will see, as shown in the figure below:
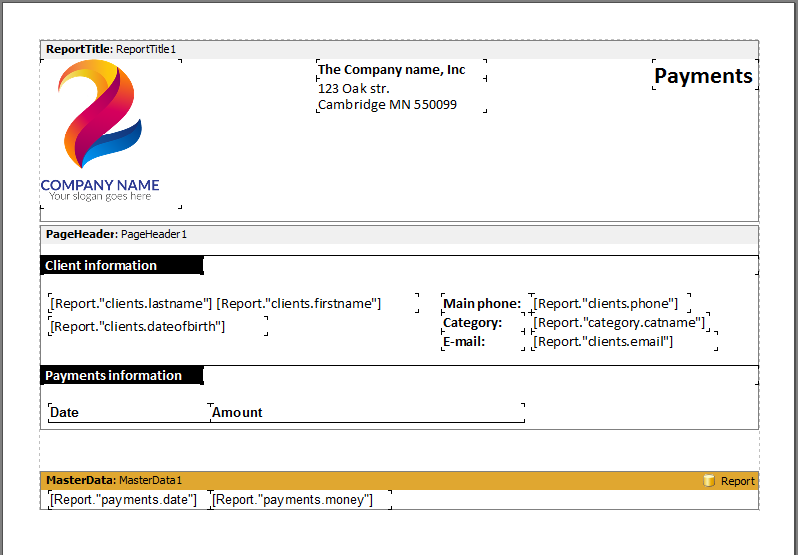
Pay attention to the [Report. "payments.money"] field, which displays the price of the payment. Let's apply monetary formatting to this field, i.e. add a separator of thousands and mandatory two decimal places. To do this, right-click on this field and select "Display Format..." in the menu.
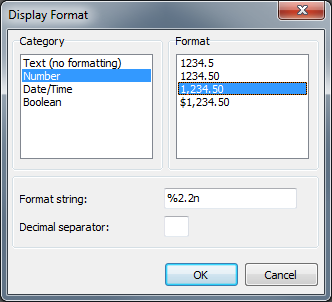
Choose the value Number in the Category list and 1,234.50 in the Format list, then click OK.
Place the next Footer block. This block will print once at the end of the report, i.e. you will not see it on every page of your report.
In this block you can calculate, for example, the total amount of all payments from the client.
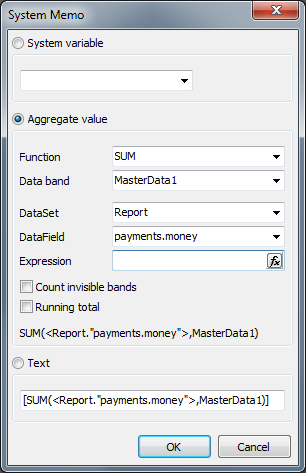
To calculate the total amount, place the System text  component in this block. Once you have placed this component, a dialog box will appear and you need to configure it as shown in the figure below:
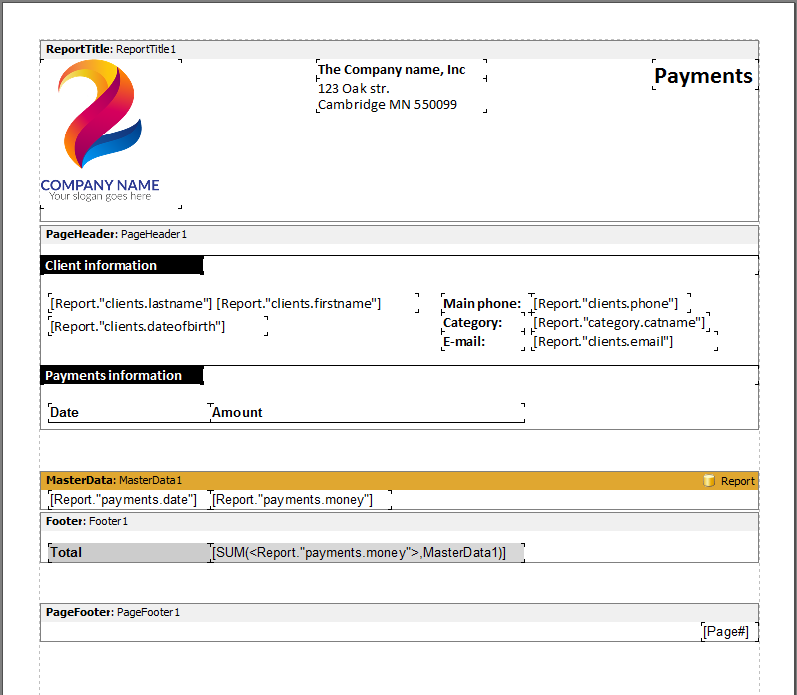
After that, your report template should look as shown in the figure below:
You can also apply monetary formatting to this field, as described in the previous step.
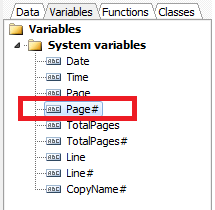
And the last block that we will place in the report is Page Footer, this block will be printed on each page of the report, we use it to numerate the pages.
Place the Page# system variable in this block from the right side of the report designer (Variables tab), just drag and drop:
Now your report template is fully ready
Go to the File > Preview menu or just press Ctrl+P to see what your report will look like.
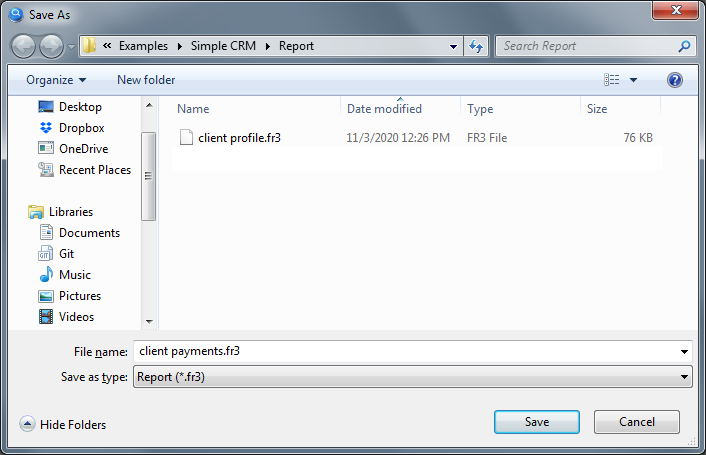
Save the report template to the Report folder of your project, menu File > Save As... Give the file a name such as "client payments" as shown in the figure below:
It remains to go back to the settings of this button and select this report template to use for printing:
Here we go. Now you can start the project again. After selecting the desired client in the GridClients component, click on this button and you'll see a printable report with the selected client data and its payment list.
Sometimes it is convenient to place this button for printing directly on the form of adding/editing a record. In this case, leave the list blank in the button settings "1. Select the components involved in the search". If the button with the "Report" action is placed on the form intended for adding/editing a record, it automatically recognizes which one should be sent to print.
Documentation on working with the report designer can be found here https://www.fast-report.com/public_download/UserManual-en.pdf