sonixax wrote:Any comments?
In the example you indicated:
Update the ChartBar creation code part:
  ChartBar := TChart.Create(Form1);
  ChartBar.Parent := Form1.PanelBar;
  ChartBar.Align := alClient;
  ChartBar.AddSeries(TBarSeries.Create(ChartBar));
  ChartBar.Series[0].XValues.DateTime := true;
  TBarSeries(ChartBar.Series[0]).marks.Style:=smsValue;
  Form1.bBarUpdate.Click;
Update procedure Form1_bBarUpdate_OnClick
procedure Form1_bBarUpdate_OnClick (Sender: string; var Cancel: boolean);
var
    Results: TDataSet;
    DateValue: Double;
    QtyValue, Lab: string;
begin
    ChartBar.Series[0].Clear;

    SQLQuery('SELECT date, qty, CASE strftime(''%d'', date)*1 WHEN 1 THEN ''Jan'' WHEN 2 THEN ''Feb'' ELSE ''Other'' END AS Lab FROM bar_data ORDER BY date DESC', Results);

    while not Results.Eof do
    begin
        DateValue := SQLDateTimeToDateTime( Results.FieldByName('date').asString );
        QtyValue := Results.FieldByName('qty').asString;
        Lab := Results.FieldByName('Lab').asString;

        if ValidInt(QtyValue) then ChartBar.Series[0].AddXY(DateValue, StrToInt(QtyValue), Lab);
        Results.Next;
    end;

end;
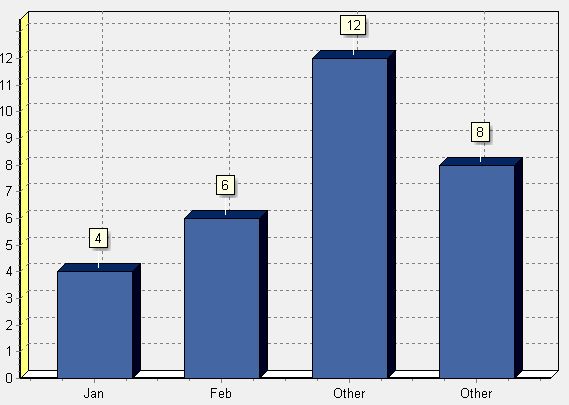
On the X axis we now display months as an example.
Post's attachments ex.jpg 32.84 kb, 23 downloads since 2024-04-02